

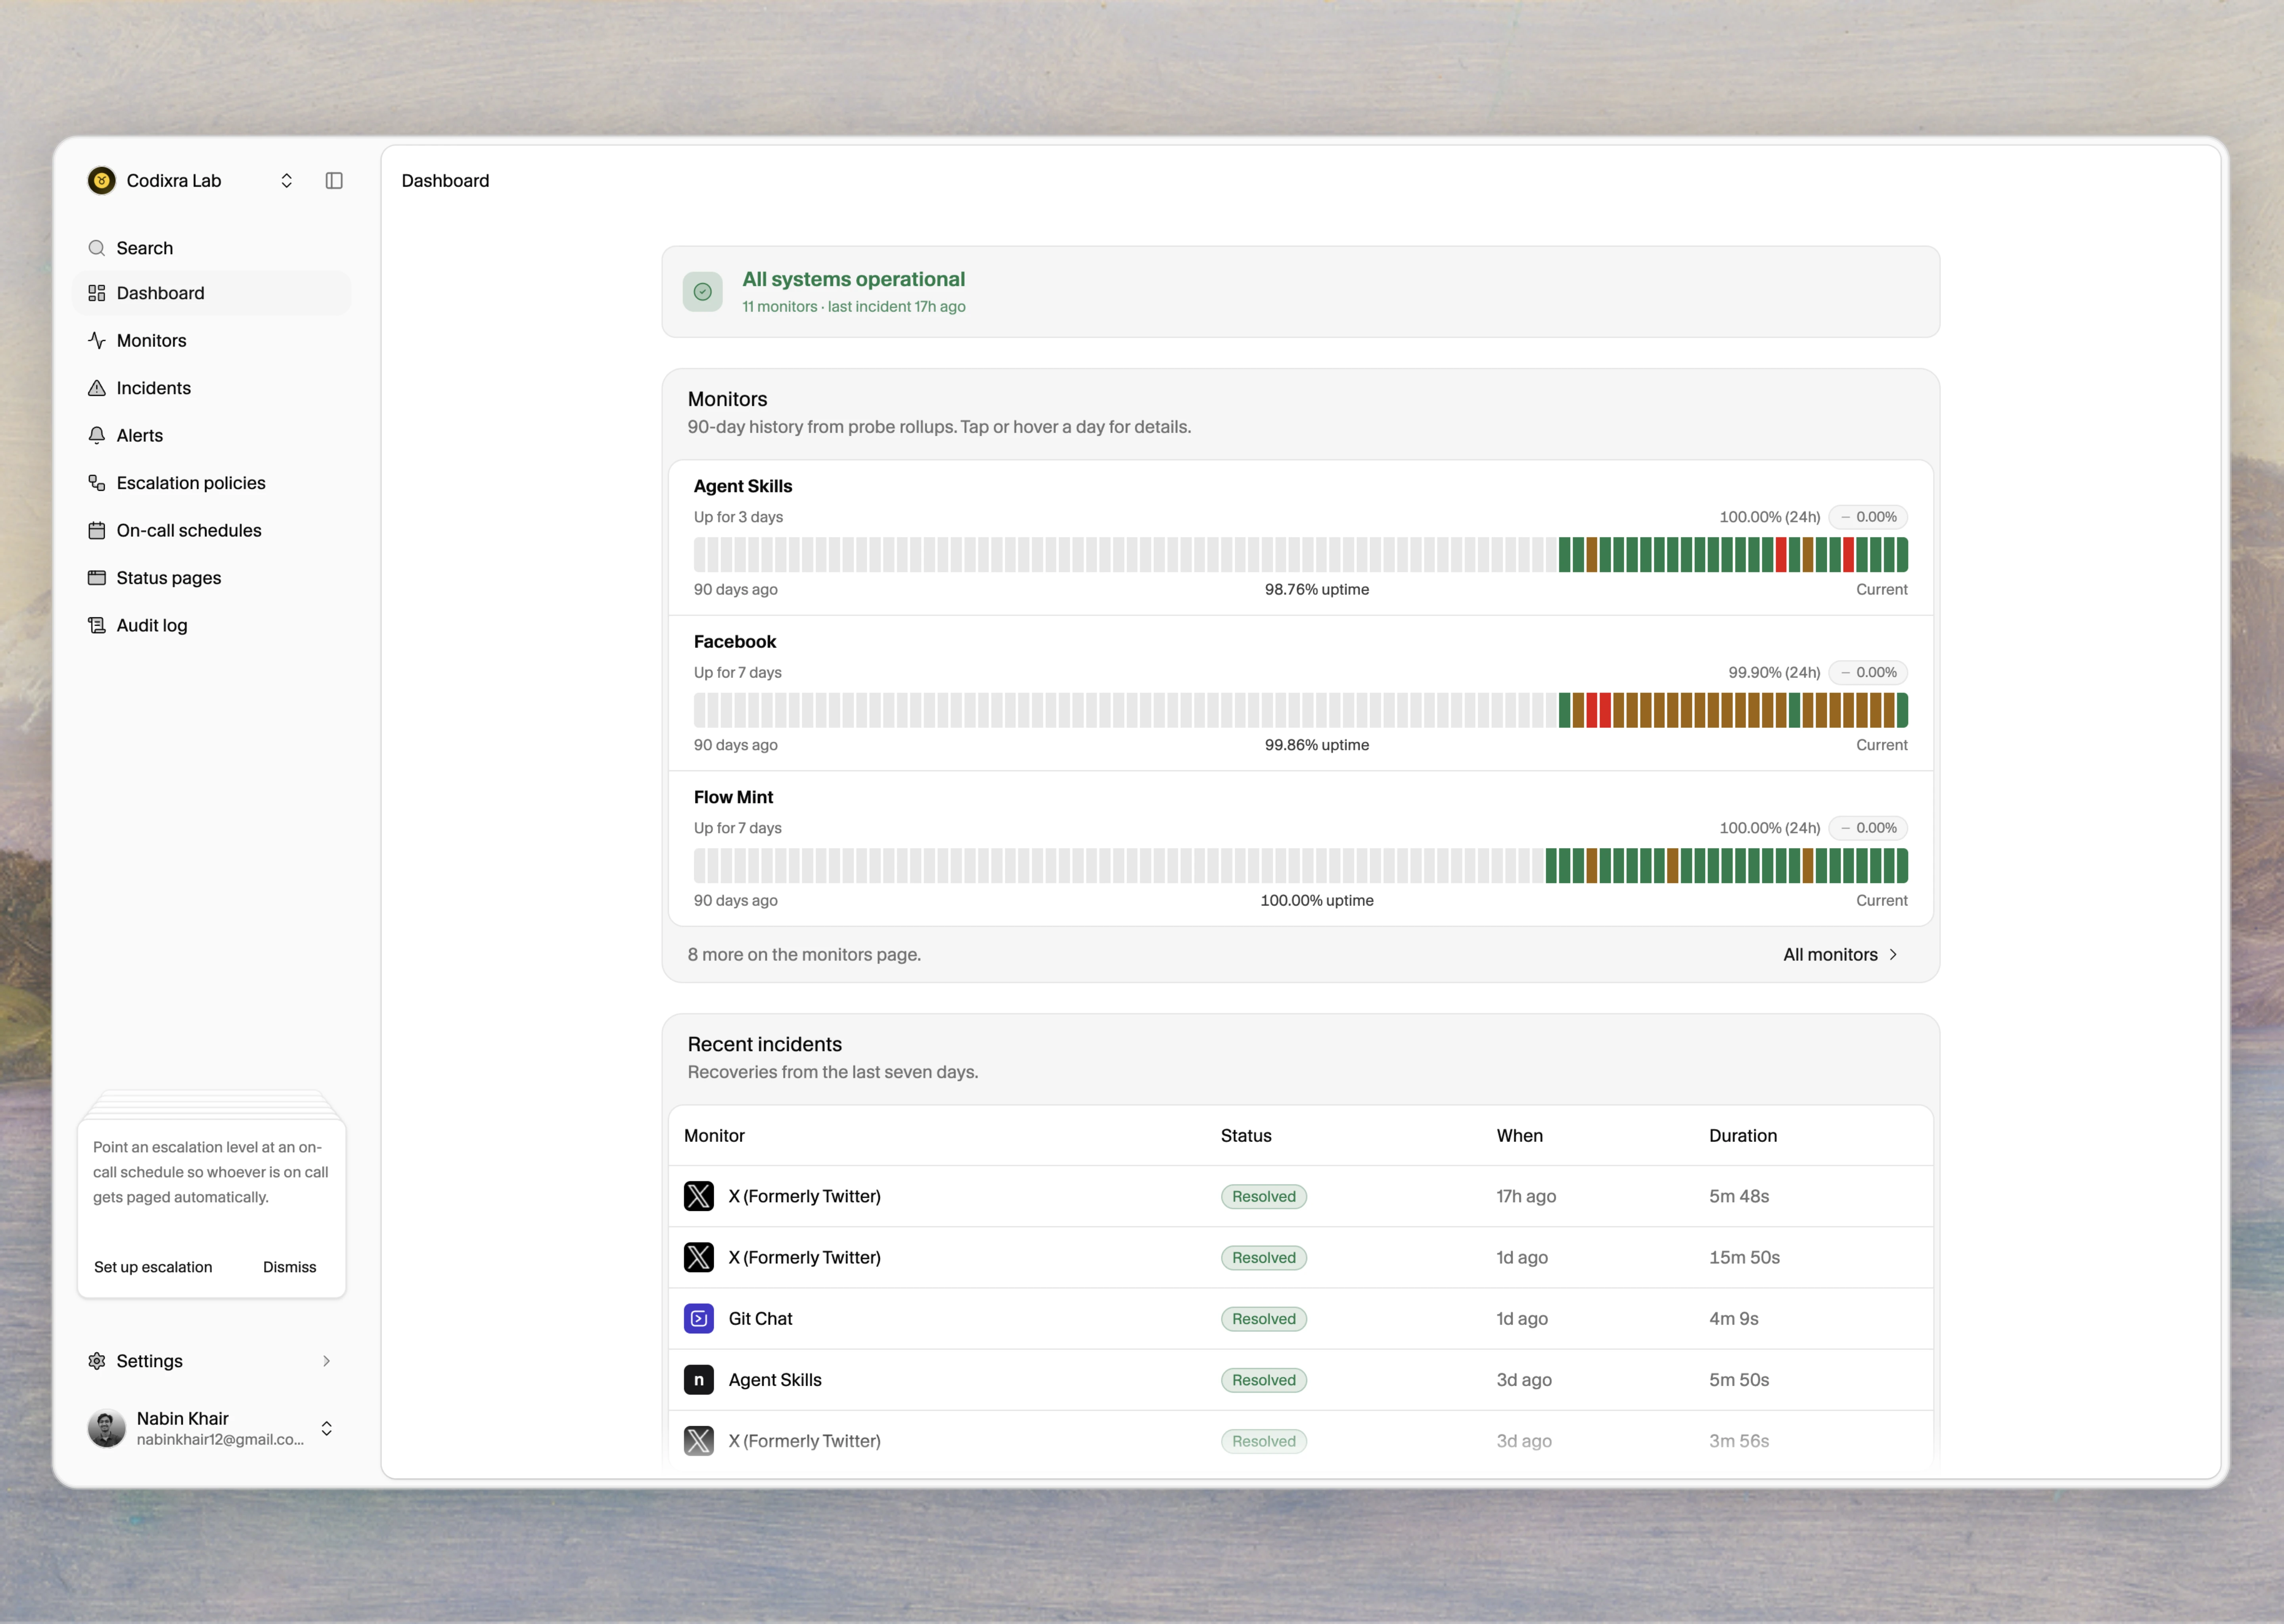
How it works
You create a monitor, pick a check type, and choose the regions that should run it. Each region probes independently. If enough regions vote down in that round, Tallwatch opens an incident. On create you pick one of six check kinds: HTTP/Website, TCP, DNS, SSL, Ping (ICMP), or Heartbeat.Keyword is edit-only for existing monitors. For a new content check, create an HTTP monitor and add a content check.
Monitors
HTTP, TCP, DNS, SSL, Ping, or Heartbeat. Regions, interval, assertions.
Incidents
Open, acknowledge, resolve. When alerts stay quiet on purpose.
Alerts
Slack, Discord, Teams, Telegram, email, webhook.
Escalation
Keep paging until someone acknowledges.
On-call
Rotations and overrides.
Status pages
Public uptime on your domain.
API and MCP
Scripts, CI, or an AI agent with a Bearer key.