

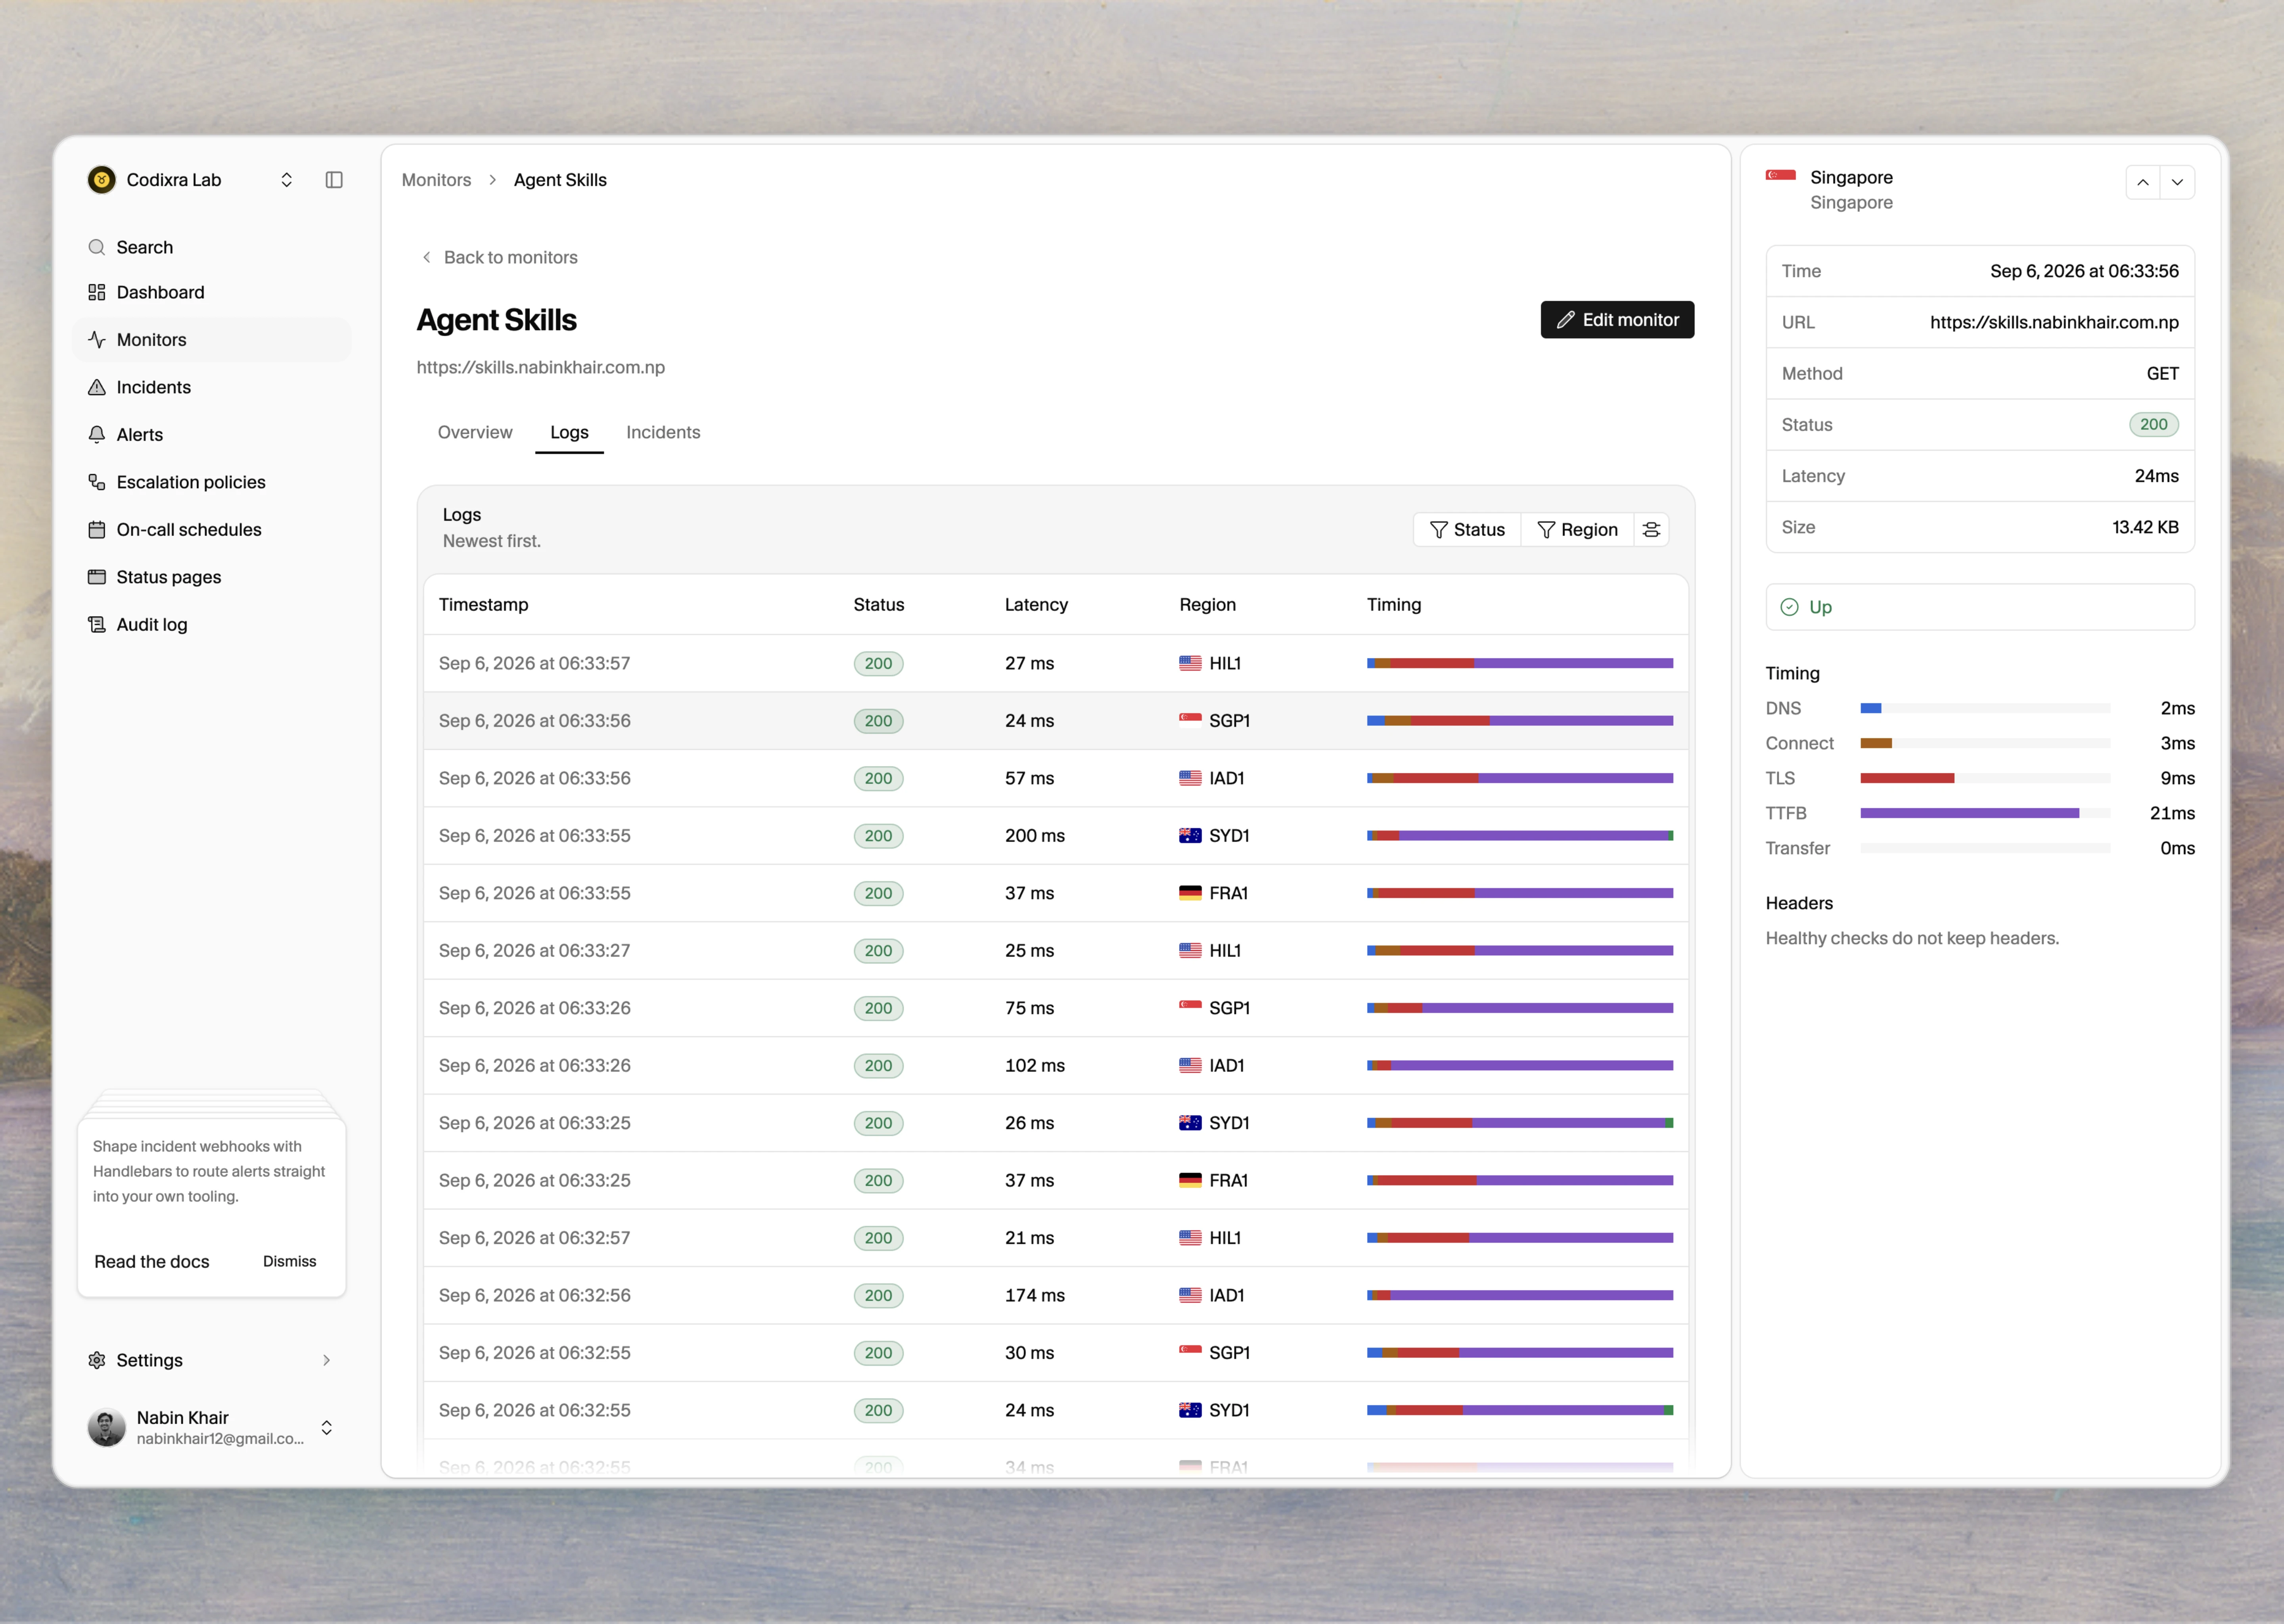
What each row shows
Healthy checks stay lean on purpose: headers and body samples are kept on fail paths, not on every green 200. That keeps storage and privacy bounded while still answering “what did the origin return when it broke?”
Filters and retention
Filter by status or region. Pages use cursor pagination (same pattern as other Tallwatch lists). Raw check rows are kept for about 30 days. Longer charts use five-minute rollups on the Overview tab, not the Logs list.Logs vs incident evidence
Evidence freezes the regional votes and probe facts at open. Logs are the continuous history. Use both; they are not the same screen.
API and MCP
GET /api/v1/monitors/:id/checks— list (no fullresponse_meta)GET /api/v1/monitors/:id/checks/:checkId— one check including failure meta- MCP:
list_monitor_checks,get_monitor_check